NFL Futures Hold Percentage: Vig & True Odds
 Available in US
I placed my first NFL futures bet nine years ago — a Super Bowl longshot at 40/1 that looked like a gift. What I didn’t understand then was that the bookmaker had already built a substantial edge into that price before I’d even opened my wallet. The hold percentage on NFL futures markets typically sits between 20% and 30%, compared with roughly 4.5% on a standard match-day spread. That difference is enormous, and most punters never think about it.
Hold percentage is the bookmaker’s theoretical margin — the gap between what they pay out and what they take in across an entire market. On a two-way spread bet, the vig is visible and relatively small. On a futures market with 32 teams or 88 MVP candidates, that margin gets spread across dozens of outcomes, making it nearly invisible to anyone who doesn’t do the arithmetic. Understanding this number is the single most important step you can take before placing a season-long wager, because it determines whether you’re starting from a small disadvantage or a catastrophic one.
This piece breaks down exactly how hold works on NFL futures, why it varies so dramatically across different markets, and what you can do to tilt the maths back in your direction.
Futures Hold vs Match-Day Vig Margin Comparison
A few years into covering these markets, I started logging the implied probabilities of every Super Bowl futures board I could find. The total always summed to well over 100%. That overage is the hold, and the size of it should make any bettor pause.
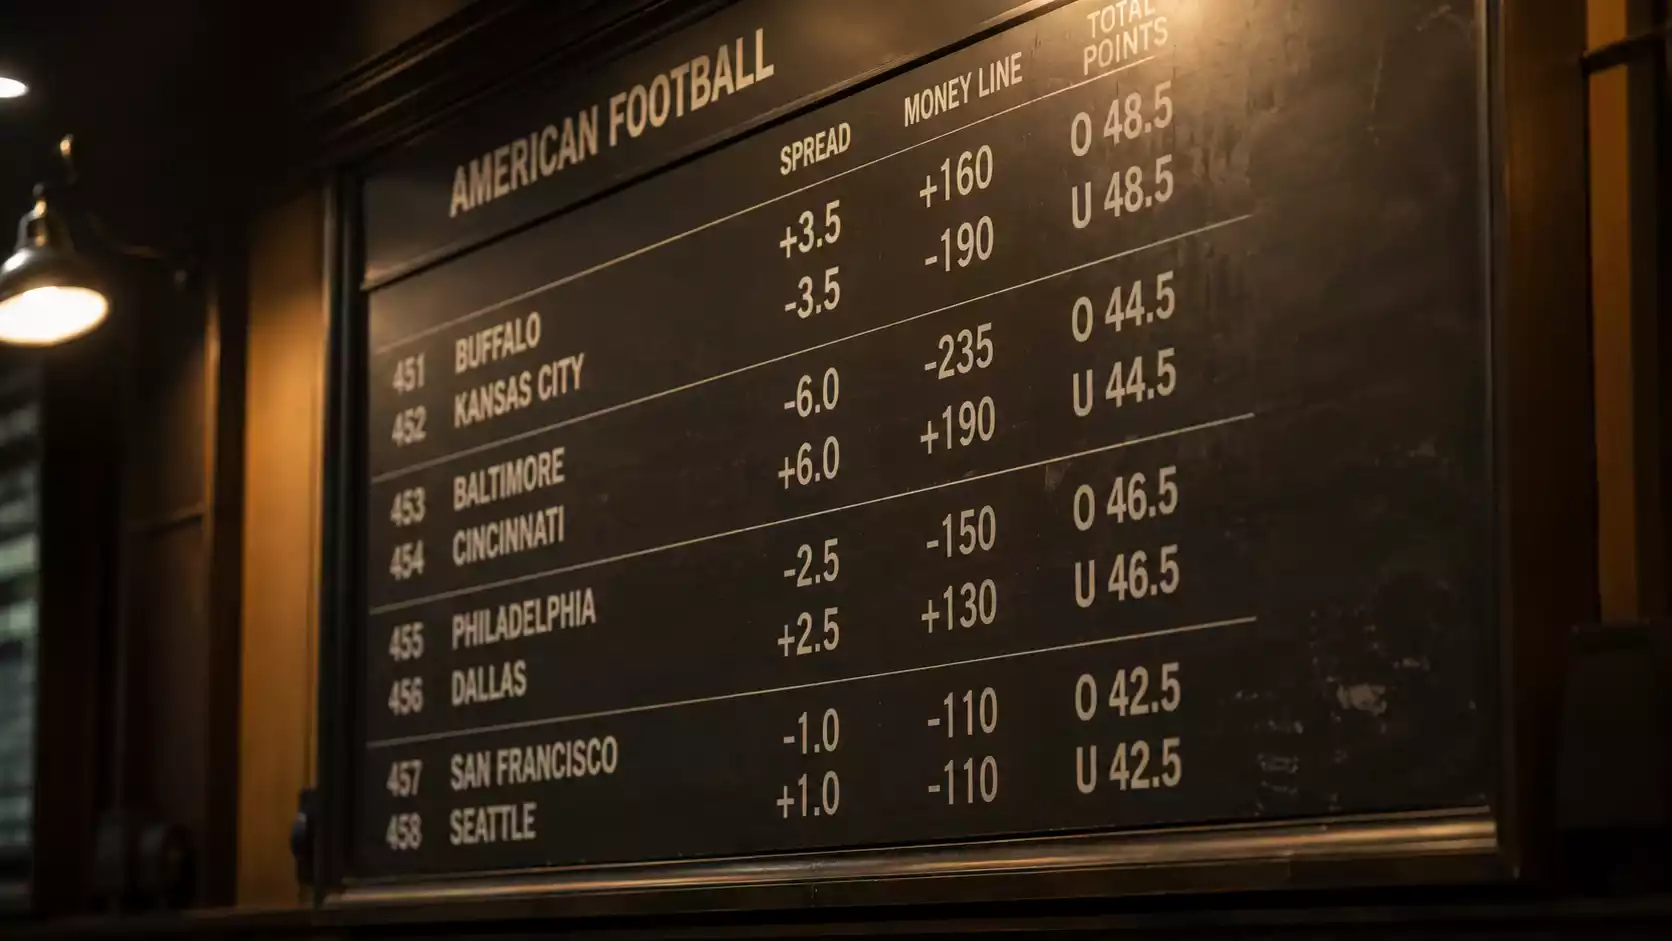
On a typical NFL point-spread bet, a bookmaker offers -110 on both sides. Each side implies a 52.4% probability, totalling 104.8%. The hold is that 4.8% excess — roughly 4.5% after adjusting for balanced action. It’s a manageable cost of doing business. You need to win about 52.4% of your bets to break even, and skilled bettors can clear that bar over large samples.
Futures markets work differently. When you add up the implied probabilities of all 32 NFL teams to win the Super Bowl, the total regularly lands between 120% and 130%. That 20-30% overage is the hold. It means the bookmaker has priced in a much larger cushion across the entire field, and every individual price you see is shorter than it should be relative to the team’s true chance of winning.
The effect compounds on markets with more outcomes. An MVP futures board often lists 88 or more candidates. When I tallied the implied probabilities on a major bookmaker’s MVP market last season, the total exceeded 154%. That means the hold was north of 54% — more than ten times the margin on a standard spread. You’re not just paying a small fee for access to the market; you’re starting from a position where over half of every pound you wager is theoretically claimed by the margin before a single snap is played.
Same-game parlays push this further still. The hold on SGPs runs between 20% and 35%, and their share of total handle has more than doubled since 2019, now exceeding 30% of all money wagered. Bookmakers love them precisely because the margin is so generous. For futures bettors, the lesson is clear: before you evaluate any team or player, you need to know the cost of entry into that specific market.
Here’s a quick reference for typical hold ranges across NFL betting products:
| Market Type | Typical Hold | Outcomes |
|---|---|---|
| Point spread | 4-5% | 2 |
| Moneyline | 4-6% | 2 |
| Division winner | 10-18% | 4 |
| Super Bowl winner | 20-30% | 32 |
| Conference winner | 15-25% | 16 |
| MVP | 40-54% | 80-100+ |
| Same-game parlay | 20-35% | Varies |
Calculating No-Vig Odds and True Implied Probability
The numbers on the board lie to you — politely, consistently, and by design. Every posted price overstates the probability of that outcome occurring. Stripping out the vig reveals the bookmaker’s actual assessment, and the method is simpler than most people expect.
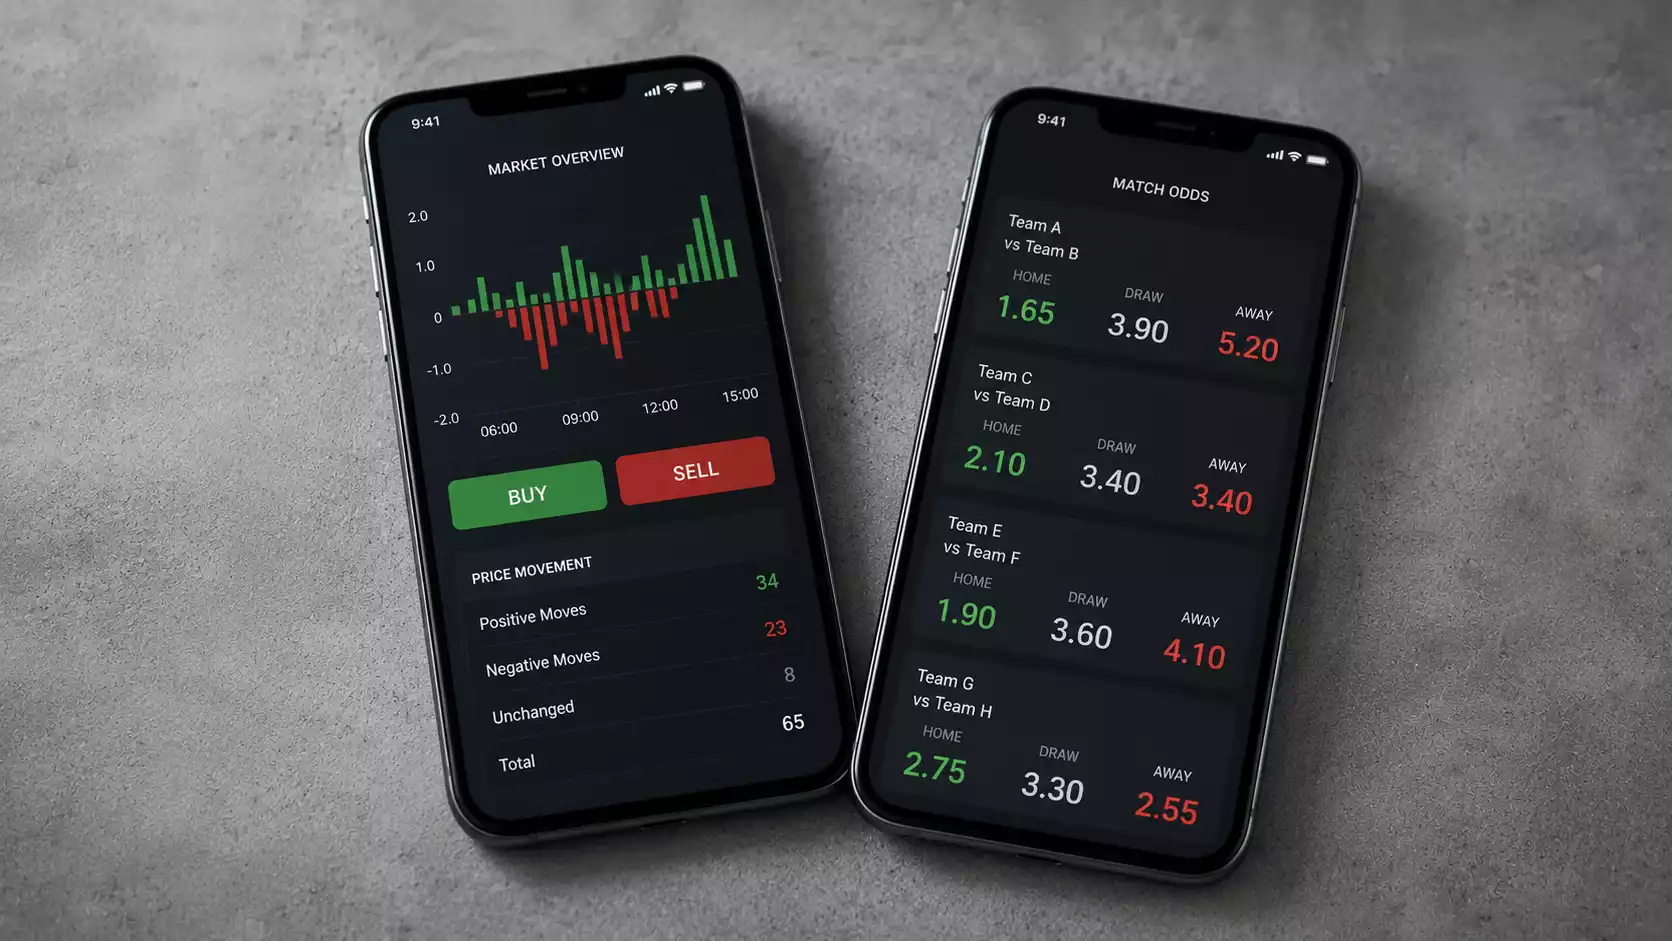
Start with implied probability. If a team is priced at 5/1 in fractional odds, the implied probability is 1 / (5 + 1) = 16.7%. In decimal odds, a price of 6.00 gives you 1 / 6.00 = 16.7%. For American odds, positive figures work as 100 / (odds + 100), so +500 yields 100 / 600 = 16.7%. All three formats express the same thing.
Now here’s where it gets useful. Calculate the implied probability for every outcome in the market, then sum them. On a Super Bowl futures board, that total might come to 125%. Each individual probability is inflated by the same proportional amount. To find the no-vig (or “true”) probability for any single outcome, divide its implied probability by the total.
Suppose a team shows an implied probability of 16.7% on a board that sums to 125%. The no-vig probability is 16.7% / 125% = 13.3%. That’s the bookmaker’s real estimate of the team’s chance — and the fair price would be roughly 6.5/1 rather than the posted 5/1. The gap between 5/1 and 6.5/1 is the tax you’re paying.
I run this calculation on every futures position I take. It sounds tedious, but it takes about ten minutes with a spreadsheet and the full odds board from any major bookmaker. The exercise forces you to see past the posted number and assess whether your own estimate of a team’s probability exceeds the no-vig figure. If it does, you have a potential value bet. If it doesn’t, the vig is eating whatever edge you thought you had.
One subtlety worth noting: bookmakers don’t distribute the vig evenly. Favourites tend to carry a smaller proportional markup than longshots, because the favourite attracts more money and the bookmaker needs to keep that price competitive. The biggest vig load falls on the longest prices in the market — exactly the bets that look most appealing to recreational punters hunting big payouts.
How to Reduce the Impact of High Hold on Your Bets
You can’t eliminate the hold, but you can shrink it. Over nearly a decade of working these markets, I’ve settled on three approaches that consistently narrow the gap between posted odds and fair value.
First, choose your markets deliberately. Division winner futures carry a hold of 10-18% because there are only four outcomes per division. That’s substantially less punishing than the 20-30% on a Super Bowl outright or the 50%+ on MVP. If you have a strong view on a team, a division bet often captures most of the upside at a fraction of the margin cost. Conference winners sit in the middle ground. The fewer outcomes in a market, the less room the bookmaker has to inflate every price.
Second, line shop relentlessly. The same team on the same day can be priced at 8/1 at one bookmaker and 12/1 at another. I’ve seen even wider gaps on mid-tier teams. That difference is not a rounding error — it’s the difference between a bet with a 5% edge and one with a 10% disadvantage. Maintaining accounts at multiple bookmakers and comparing prices before every futures wager is the closest thing to a free lunch in this market. For a deeper look at how to do this systematically, I’ve covered the process in the NFL futures odds comparison guide.
Third, target the timing windows where hold compresses. Early in the offseason, bookmakers post wider margins because uncertainty is high and they want protection. As the season approaches and information clarifies — after free agency, after the draft, during training camp — odds tighten and the hold on well-traded markets often drops a few points. Betting a position you’ve identified early but waiting for the optimal price can meaningfully reduce your effective vig.
None of these tactics turn a losing approach into a winning one. But they shift the baseline. Instead of starting 25% behind the bookmaker on a Super Bowl future, you might start 12-15% behind on a division bet purchased at the best available price during a compressed-margin window. That’s a fight you can actually win with good analysis.
How do you calculate implied probability from futures odds?
Divide 1 by the decimal odds to get the implied probability. For fractional odds like 5/1, the formula is 1 divided by (5 + 1), giving 16.7%. To find the true no-vig probability, sum all implied probabilities in the market and divide each individual figure by that total. The difference between the posted implied probability and the no-vig figure is your cost.
Why is the hold on MVP futures higher than Super Bowl futures?
MVP markets list 80 to 100 or more candidates, compared with 32 teams on the Super Bowl board. Each additional outcome allows the bookmaker to add a small margin, and those margins compound. A Super Bowl market typically carries 20-30% hold, while an MVP market with 88+ candidates can exceed 54%. The more outcomes, the higher the total vig.
Written by the editors at Best nfl Futures Bets.