NFL Futures Betting Strategy 2026: Portfolio Approach
 Available in US
Table of Contents

Only 3-5% of sports bettors turn a profit over the long term. That number comes from industry data, not pessimism, and it should be the first thing anyone reads before committing capital to NFL futures. The overwhelming majority of bettors lose — not because they lack football knowledge, but because they lack a systematic approach to the markets where knowledge translates into edge.
Futures markets are harder than match-day betting in almost every measurable way. The hold is higher, the capital is locked up for months, and the variance is enormous. A spread bet resolves in three hours; a Super Bowl future resolves in February. Yet most bettors approach futures with less discipline than they bring to a Saturday afternoon parlay. They back their favourite team, chase a narrative, size their bets by feel, and treat the outcome as entertainment rather than investment. That approach is fine if entertainment is the goal. If the goal is long-term profitability — or at least minimising structural losses — it requires something fundamentally different.
The most profitable NFL futures bettors treat their season-long wagers as a portfolio rather than a collection of independent bets. The word “portfolio” is not a metaphor. It means spreading exposure across multiple positions, managing correlation between those positions, sizing each bet relative to conviction and variance, and rebalancing when the market offers opportunities to hedge or add. This guide lays out the framework I use, from timing the initial entries to evaluating teams with advanced metrics. It is a process, not a prediction — and the process is what separates the 3-5% from the rest.
Timing Windows for Maximizing NFL Futures Value
I placed a Super Bowl future on a team three hours after the previous Super Bowl ended and watched the price shorten by 20% within a week. That experience taught me something I now consider foundational: in futures markets, being early is not just a preference — it is a structural advantage.
The NFL offseason creates four distinct windows where the market reprices most aggressively. The first opens immediately after the Super Bowl, when emotional reactions to the championship game distort prices across the board. The losing finalist gets overpriced by bettors who believe “they will be back,” while the champion’s conference rivals get quietly underpriced because the public’s attention is elsewhere. The second window surrounds free agency in March, when high-profile signings move lines on the teams acquiring talent — but also create value on the teams losing players, where the market often overreacts to departures. The third window follows the draft in late April, the most volatile repricing event of the offseason. And the fourth opens mid-season, typically around Weeks 6-8, when teams that started slowly see their prices drift to longshot levels despite underlying metrics that suggest they are better than their record indicates.
Each window has a different risk-reward profile, and the detailed timing breakdown covers the mechanics of each in full. The strategic principle is consistent across all four: act when the market is reacting emotionally to new information, because emotional repricing overshoots fair value in both directions. The early bird does not always win, but the early bird who has done the analytical groundwork catches the best prices more often than the bettor who waits for certainty.
Building a Futures Portfolio: Diversification Across Markets
My first season taking futures seriously, I backed three teams to win the Super Bowl, two of them from the same conference, and one quarterback for MVP who played on one of those Super Bowl teams. It felt diversified at the time. It was not. When that conference produced a different champion, every position lost simultaneously. That painful lesson is why I now approach futures like an investment manager approaches asset allocation: diversification is not about the number of bets, it is about the independence of outcomes.
A properly constructed futures portfolio spreads exposure across multiple market types: Super Bowl outright, conference winners, division winners, win totals, and select player props. Each market type carries different underlying drivers. A Super Bowl bet depends on playoff performance, which introduces tournament variance. A win-total bet depends on regular-season performance, which is more stable and predictable. An MVP bet depends on individual production and team record. By holding positions across markets with different resolution mechanisms, you reduce the probability that a single bad outcome wipes out the entire seasonal allocation.
Correlation management is the concept most bettors skip. If you back Team A to win the Super Bowl and also take their quarterback for MVP, those positions are highly correlated — the quarterback almost certainly needs to reach the Super Bowl to win MVP. If Team A disappoints, both bets lose. The diversification benefit is close to zero. I allow a maximum of one correlated pair in my portfolio per season, and even then, I size the second position at half the first to reduce the combined exposure.
The target number of positions varies by season, but my typical portfolio holds 12-18 bets across all markets: three to four Super Bowl or conference positions, six to eight win-total positions, one to two MVP positions, and two to three division or player prop positions. That spread ensures no single miss causes disproportionate damage, while the combined exposure gives the portfolio enough upside to generate meaningful returns if two or three positions hit.
Balancing favourites and longshots within the portfolio is the final structural decision. I allocate roughly 60% of my futures capital to shorter-priced positions (under 15/1) and 40% to longshots (above 15/1). The favourites provide a higher probability of return but lower magnitude; the longshots provide the portfolio’s asymmetric upside. Without the longshot allocation, the portfolio’s expected return is modest. Without the favourite allocation, the portfolio’s variance is unmanageable. Both components are essential, and the balance between them should reflect your personal risk tolerance — a more conservative bettor might shift to 70/30, while an aggressive one might push to 50/50.
Bankroll Allocation: Unit Sizing for Season-Long Wagers
A bettor I respect once told me that bankroll management is the only part of sports betting where you have complete control. You cannot control the outcome of a game, the accuracy of your model, or the movement of a line after you bet it. But you can control exactly how much you risk on each position. That control is the difference between surviving a bad season and being wiped out by one.
Futures bets require smaller unit sizes than match-day wagers for two reasons. First, the capital is locked up for an extended period — months rather than hours — which means you cannot redeploy it if better opportunities arise. Second, the variance on futures is higher because you are projecting outcomes over a much longer timeframe, where more things can go wrong. A key injury in Week 3, a coaching change in October, a mid-season trade that reshapes a team’s trajectory — all of these events can invalidate your thesis, and none of them are predictable at the time of the bet.
My unit sizing framework for futures is percentage-based: 1-2% of total seasonal bankroll per individual position. A high-conviction win-total bet gets 1.5-2%. A moderate-conviction Super Bowl position gets 1-1.5%. A speculative longshot or player prop gets 0.5-1%. This is meaningfully smaller than the 2-3% per bet I use on match-day spreads, and the reduction is entirely justified by the higher variance and longer time horizon.
Total portfolio exposure — the sum of all futures positions — should not exceed 20-25% of the seasonal bankroll. This cap exists because futures are only one component of a broader betting season that includes match-day wagers, prop bets, and playoff positions. Committing more than a quarter of your bankroll to bets that will not resolve for months leaves insufficient capital for the opportunities that arise during the regular season. I have broken this rule exactly once, in a season where the market offered what I considered extraordinary value across multiple positions. It worked out. I still would not recommend it.
The 3-5% long-term profitability rate is not a ceiling; it is a reality check. Even the best futures process will produce losing seasons. The bankroll framework exists to ensure that a losing season — or two or three in a row — does not eliminate your ability to continue playing when the edge returns. Fifty-two percent of online bettors report chasing losses after a bad run, and chasing is the single fastest route to bankroll destruction. A disciplined allocation plan removes the emotional pressure to chase, because each loss is pre-sized to be survivable.
Evaluating Teams and Players: Metrics That Matter
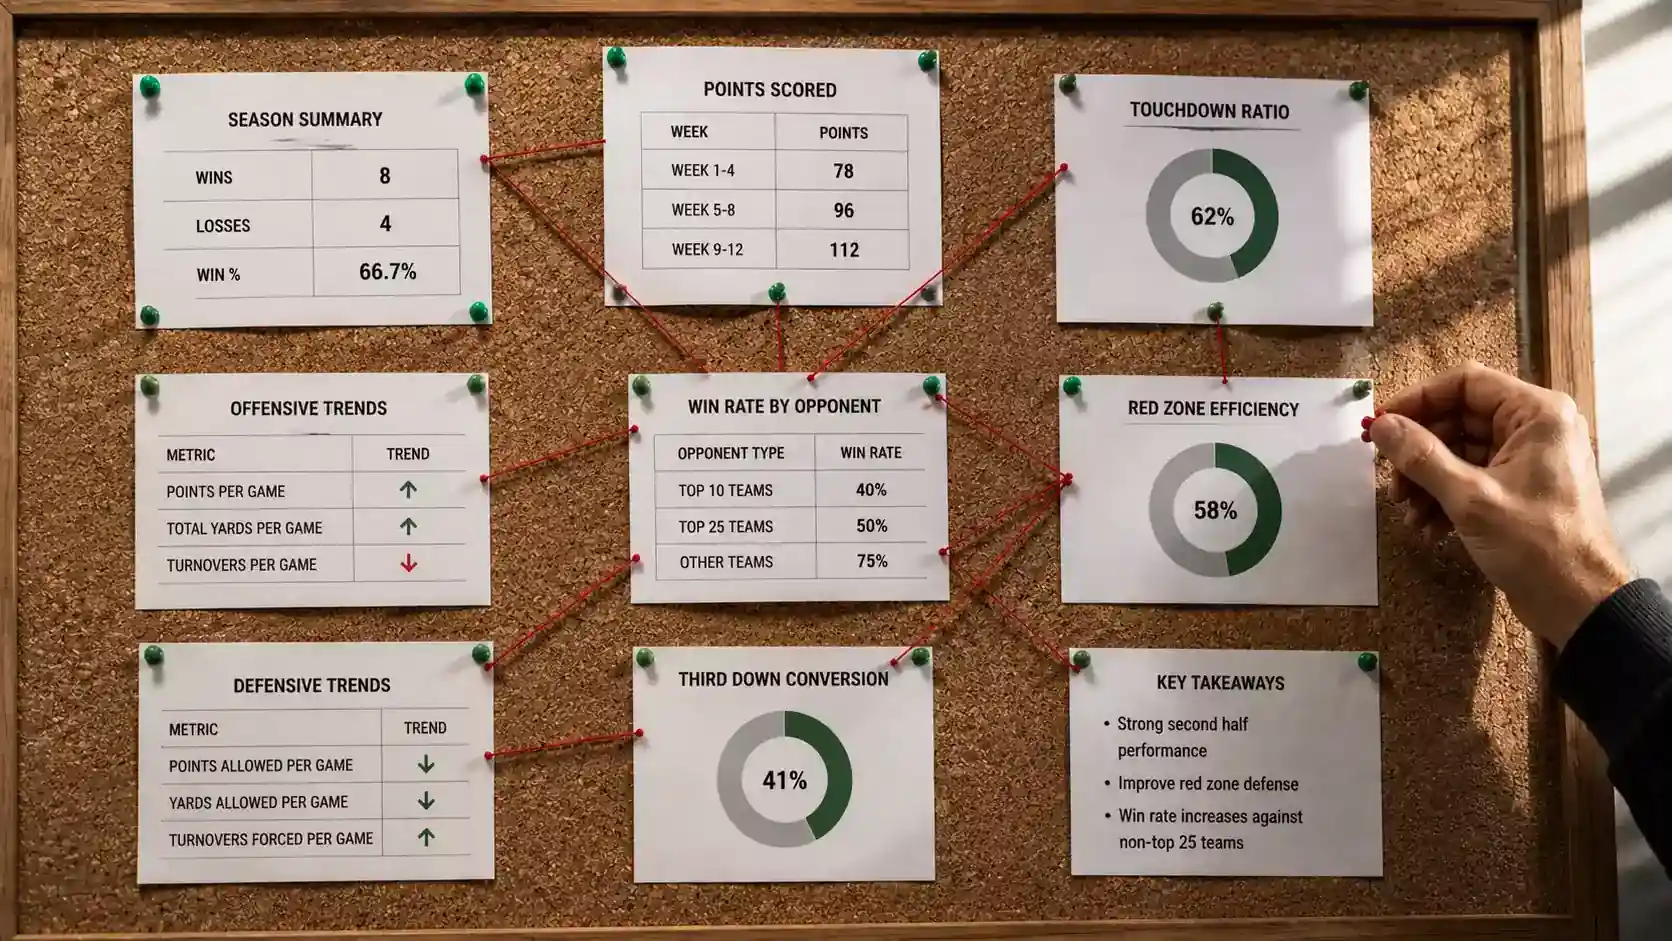
When I first started building models for NFL futures, I relied on traditional stats: yards per game, points per game, turnover margin. The results were mediocre. The breakthrough came when I switched to efficiency metrics — specifically EPA per play and DVOA — which capture the quality of each snap rather than the volume of production. A team that runs 75 plays per game and gains 350 yards looks impressive by traditional measures, but if those 350 yards came on inefficient, low-value plays (three-yard runs on first down, short check-downs on third and long), the underlying offence is weaker than the box score suggests.
EPA — Expected Points Added — measures every play against the league-average outcome from the same situation. A first-and-ten run from the 50-yard line that gains 6 yards is compared to the average outcome of all first-and-ten runs from the 50-yard line, and the difference is the EPA. Sum those values across an entire season and you have a comprehensive picture of how much value a team or player adds relative to the baseline. EPA per play correlates more strongly with future winning than any traditional statistic, which makes it the most valuable input for futures evaluation.
DVOA — Defence-adjusted Value Over Average, developed by Football Outsiders — takes a similar approach but adjusts for opponent quality. A team that posts strong offensive numbers against a weak schedule looks less impressive through DVOA than through raw stats, because the metric accounts for the quality of the defences they faced. For futures purposes, DVOA is particularly useful for identifying teams whose metrics will regress based on schedule changes: a team with strong raw EPA but middling DVOA is one whose production was inflated by easy opponents.
Win probability models offer a third layer. These models simulate the rest of the season based on current team ratings, schedule, and home-field advantage, producing a probability distribution for every win-total outcome and every playoff scenario. I cross-reference my EPA/DVOA evaluations with win-probability simulations to ensure I am not over-indexing on a single metric. When all three inputs agree — EPA says the team is undervalued, DVOA confirms it after opponent adjustment, and the simulation model shows a higher win probability than the market implies — that is a high-conviction position.
The good news for UK bettors who want to use these metrics: all of them are available for free. EPA data is published weekly through several public analytics platforms. DVOA is updated throughout the season by Football Outsiders. Win-probability simulators are available from multiple sources and require no subscription. The barrier to entry is not access; it is the willingness to spend a few hours each week reviewing the numbers and updating your projections. Most bettors will not do that, which is precisely why the edge exists for those who will.
Here is how this looks in practice. Say you are evaluating a team priced at 20/1 for the Super Bowl. Their win-loss record last season was 9-8, unremarkable on the surface. But their offensive EPA per play ranked 8th in the league from Week 8 onward — the relevant window, because they installed a new scheme in the offseason and the learning curve took seven weeks. Their DVOA climbed from 18th overall in September to 6th by December. The win-probability model, using their second-half metrics as the baseline, projects them for 11.2 wins this season with a 7% chance of reaching the Super Bowl. The bookmaker’s 20/1 price implies roughly 4.8%. That gap — 7% versus 4.8% — is a 46% overlay, well above the 30% threshold I require. The bet qualifies. Strip out the record-based narrative and evaluate the process-based metrics, and the market’s mispricing becomes visible.
Contrarian Thinking: Fading Public Favourites
The public loves a good story. A team that made the conference championship, added a marquee free agent, and enters the season with a charismatic head coach generates attention, handle, and — inevitably — a price that reflects enthusiasm more than probability. My job as a futures bettor is to ask whether the enthusiasm is justified by the data, and more often than not, the answer is: partially, but not at this price.
Joe Osborne, one of the sharper voices in the betting media, nailed this when he advised against reading too much into narratives when placing bets, because those factors are already baked into the odds. The market is not stupid. If a team’s narrative is widely known — and any story that makes national sports media qualifies — the bookmaker has already adjusted the line to account for the public money that narrative will attract. What the market does not always adjust for is the counter-narrative: the regression indicators, the schedule hardening, the coaching turnover at coordinator level that does not make headlines.
Public money patterns in NFL futures are remarkably consistent year to year. The defending Super Bowl participants attract outsized handle regardless of roster changes. Teams that made splashy free-agency signings see their prices shorten more than the signing warrants. Teams coming off losing seasons in large media markets (Dallas, New York) generate “bounce-back” narratives that drive the line lower than the underlying talent supports. Each of these patterns creates a predictable overreaction that the contrarian bettor can exploit.
The sportsbook side of this equation is revealing. When bookmakers identify their “worst outcomes” — the teams whose victories would cost them the most money — they are telling you where the public’s money has concentrated. A team that the bookmaker explicitly names as a liability leader is a team the public has backed heavily, which means its price is shorter than it should be. Fading that team, or at minimum avoiding it, is a straightforward contrarian application. The liabilities are sometimes made public through industry reporting, and I track them as a supplementary data point throughout the offseason.
There is an important counterbalance to the contrarian instinct: sometimes the consensus is right. A team with a generational quarterback, a top-five defence, and a favourable schedule deserves its short price, and fading it purely because the public likes it is as irrational as backing it purely because the narrative is compelling. The discipline is in the data, not the contrarianism itself. I fade when the regression signals, the schedule analysis, and the hold structure all point in the same direction. When they do not, I leave the position alone — even when the contrarian case feels satisfying to make.
Futures Strategy: Common Questions
How many futures bets should a portfolio contain?
I aim for five to eight total positions across all NFL futures markets combined — Super Bowl, MVP, win totals, and any division or conference winner bets that clear my value threshold. Fewer than five leaves you too concentrated in a single outcome; more than ten dilutes your edge and makes tracking unwieldy. The exact number depends on how many genuinely mispriced opportunities the market presents in a given offseason. Some years I find seven strong positions by June; other years I struggle to identify four. Never force bets to fill a quota.
Should you take current odds or wait for better lines?
Neither — the answer is situational. If your model shows clear value at the current price and you have reason to believe the line will shorten (public money loading onto the same team, upcoming free agent signing), take it now. If the market is still digesting a coaching change or an injury and you expect volatility in both directions, waiting can pay. The mistake most bettors make is waiting for certainty, because certainty means the line has already moved past the value point. I place roughly 60% of my positions before the draft and the remaining 40% between September and Week 8.
What is expected value and how does it apply to NFL futures?
Expected value — often shortened to EV — measures whether a bet is profitable over time. You calculate it by multiplying the probability of winning by the potential profit, then subtracting the probability of losing multiplied by the stake. If that number is positive, the bet has positive expected value. In futures terms, if you estimate a team has a 10% chance of winning the Super Bowl and the bookmaker offers 14/1 (implying roughly 6.7%), you have a +EV position. The challenge is estimating the true probability accurately, which is why the analytical framework matters more than any single calculation.
How do you track and manage a season-long futures portfolio?
I use a straightforward spreadsheet with columns for the team or player, the market (Super Bowl, MVP, win total), the odds at entry, the implied probability, my estimated probability, the stake in units, and the current market price updated weekly. I also track the running P&L of the portfolio and note any hedge opportunities that arise mid-season. Reviewing the portfolio after each week keeps you disciplined about hedging or adding positions, and it prevents the common error of forgetting what you bet and at what price. The spreadsheet is the portfolio — without it, you are gambling, not investing.
Published by the Best nfl Futures Bets team.