NFL Futures Implied Probability: Calculating True Odds
 Available in US
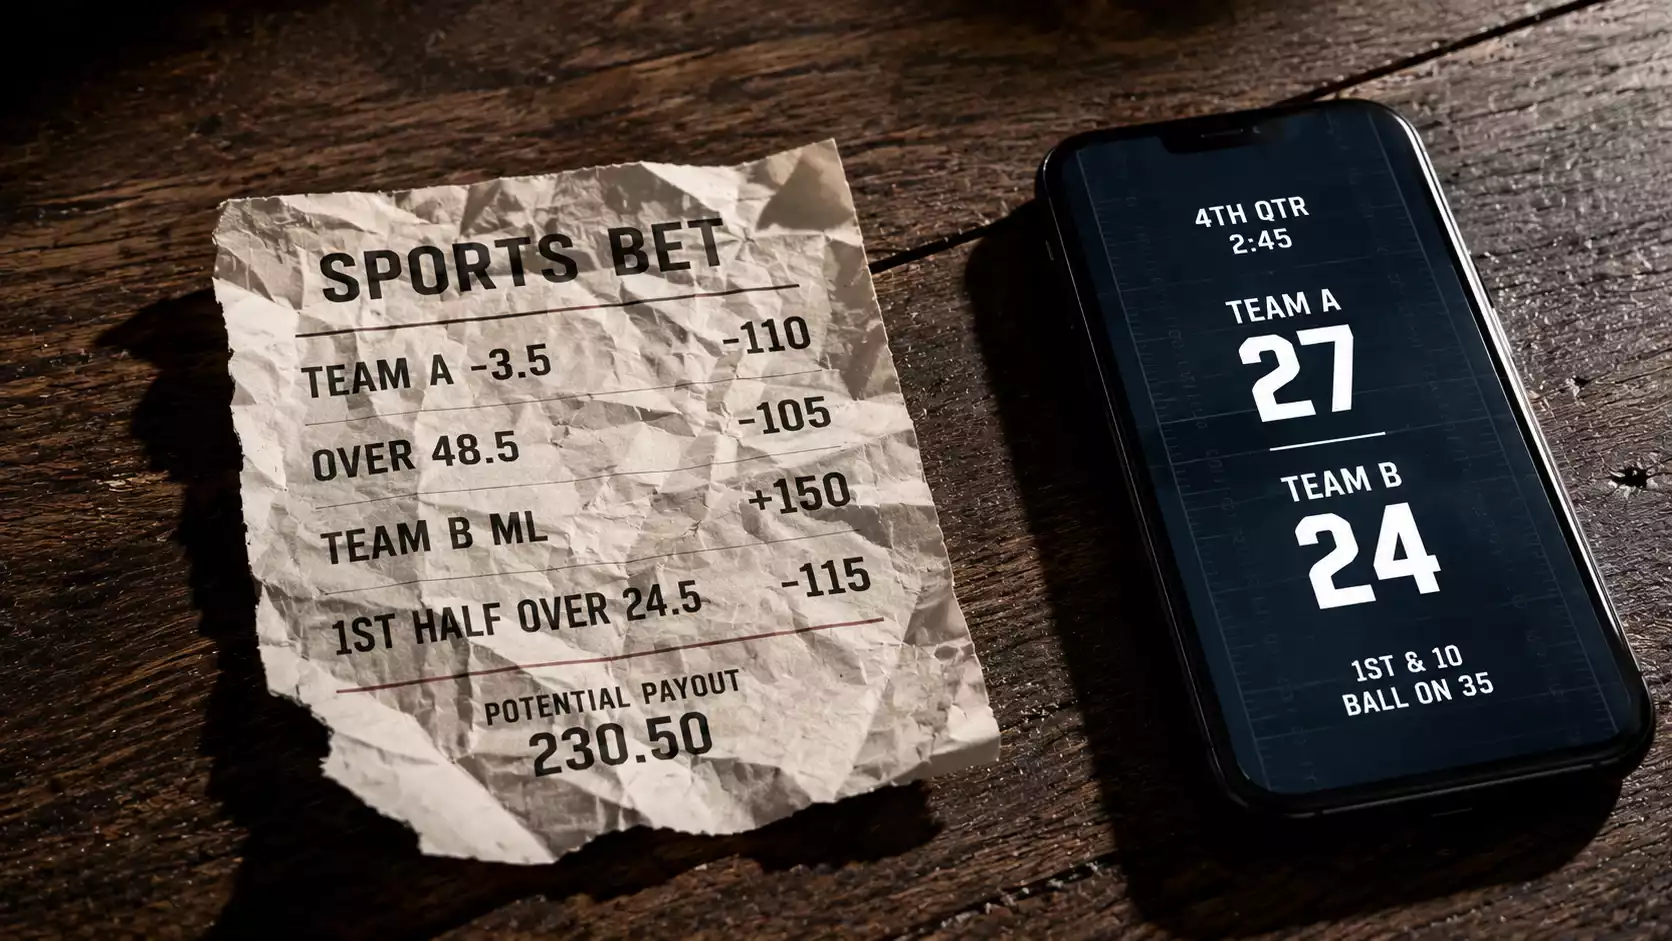
The first time I calculated implied probability on an NFL futures market, I added up all the individual probabilities and got 142%. That felt wrong — probabilities should sum to 100%. Then I realised that the extra 42% was the bookmaker’s margin, baked into every price on the board. That moment changed the way I evaluate every futures bet. Once you understand implied probability and how to strip the margin from it, you stop seeing odds as numbers and start seeing them as claims about reality — claims you can agree with, dispute, or exploit.
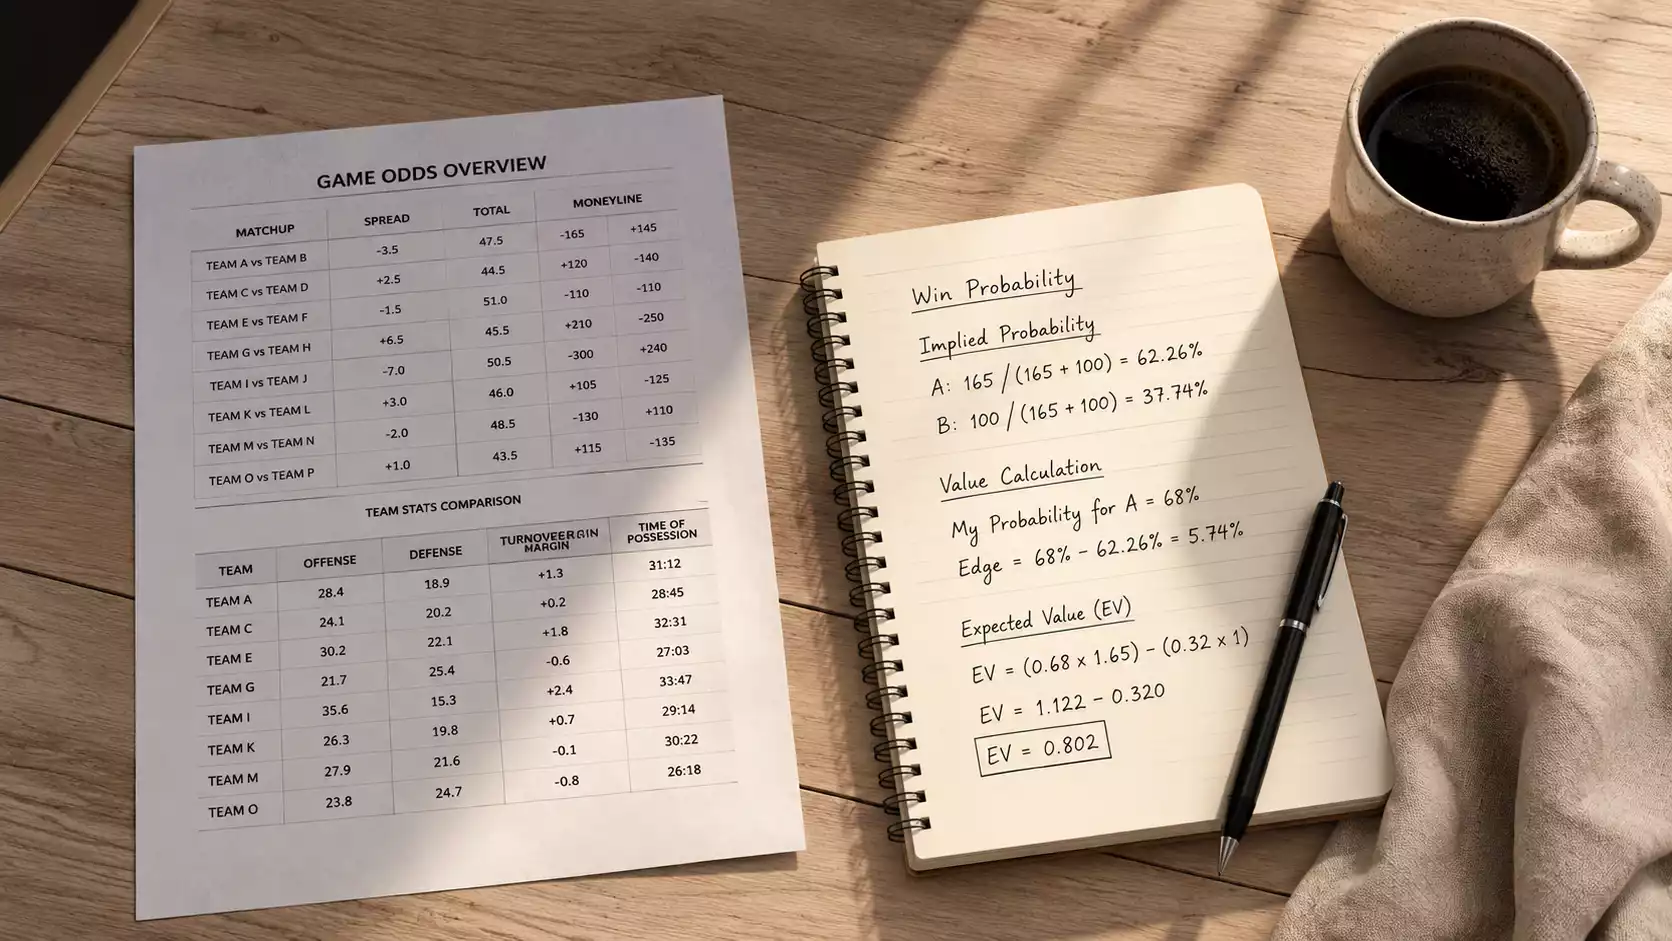
Implied probability is the conversion of betting odds into a percentage chance of an outcome occurring. It answers the question: “According to this price, how likely does the bookmaker think this is?” Comparing that answer to your own assessment is the foundation of every value bet. If the bookmaker’s implied probability says a team has a 10% chance and your analysis says 15%, the gap is your edge.
Fractional Odds and Implied Probability Calculations
Most UK bettors see odds in fractional format — 5/1, 7/2, 11/4. I spent years reading these without properly converting them, relying on gut feel to decide whether a price was “good.” That’s like judging house prices by how nice the front door looks. The maths is simple but essential.
For fractional odds expressed as A/B, the implied probability formula is: B divided by (A + B), multiplied by 100 to get a percentage. At 5/1, that’s 1 / (5 + 1) = 0.1667, or 16.67%. At 7/2, it’s 2 / (7 + 2) = 0.2222, or 22.22%. At 11/4, it’s 4 / (11 + 4) = 0.2667, or 26.67%.
These numbers represent the minimum probability you need to believe in for the bet to break even. If you back a team at 5/1, you’re saying — whether consciously or not — that the team has at least a 16.67% chance of winning. If your honest assessment is 12%, the bet is negative expected value regardless of how exciting the team looks. If your assessment is 22%, the bet offers significant edge. I keep a spreadsheet where I log my probability estimate next to every futures bet, and reviewing that spreadsheet at season’s end is the single most educational exercise I do each year.
The fractional format common in UK bookmakers has one quirk worth noting. Odds like 6/4 and 3/2 represent identical prices (40% implied probability), but some bettors instinctively feel that 6/4 is a “bigger” price. Similarly, 11/10 and evens (1/1) sit very close in probability terms — 47.62% vs 50% — yet feel psychologically different. Training yourself to see through the fractional presentation to the underlying probability is a discipline that pays off across every market you trade.
Decimal and American Odds: Conversion and Probability
When I research NFL futures, I’m reading US-based sites that quote American odds and international sites that use decimal format. Converting on the fly used to slow me down until I drilled the formulas into muscle memory.
Decimal odds are the simpler conversion. The implied probability is 1 divided by the decimal odds, multiplied by 100. Decimal 6.00 = 1/6 = 16.67%. Decimal 3.50 = 1/3.5 = 28.57%. Decimal 1.50 = 1/1.5 = 66.67%. Decimal odds have the advantage of always including the returned stake, which makes payoff calculations intuitive — stake multiplied by the decimal odds equals total return. For comparing prices across different UK bookmakers, decimal format is often clearer than fractional because it sidesteps the visual confusion of comparing, say, 15/8 with 9/5.
American odds require a different formula depending on whether the number is positive or negative. For positive American odds (e.g., +500): implied probability = 100 / (American odds + 100). So +500 gives 100 / 600 = 16.67%. For negative American odds (e.g., -150): implied probability = absolute value of the odds / (absolute value of the odds + 100). So -150 gives 150 / 250 = 60%. Most NFL futures that UK bettors encounter are priced at positive American odds, since futures markets deal predominantly in longshots. The conversion matters most when reading US analysis sites that quote lines in American format — translating those prices into implied probabilities lets you compare them directly with your UK bookmaker’s offerings.
I don’t recommend memorising every conversion. Instead, internalise a few reference points: +100 = 50%, +200 = 33.3%, +300 = 25%, +500 = 16.7%, +1000 = 9.1%. Everything else you can interpolate from there.
Stripping Out the Vig: Finding No-Vig Probability
Here’s where the maths gets practically useful. The implied probabilities from raw odds always sum to more than 100% because the bookmaker’s margin — the vig — is embedded in every price. On Super Bowl futures, the typical hold is 20-30%, meaning all the individual implied probabilities add up to 120-130%. On MVP markets with 80+ candidates, that overround can exceed 150%, embedding more than 50 percentage points of margin into the prices.
To find the “true” probability — what the bookmaker actually thinks the chances are before adding margin — you need to remove the vig. The simplest method is proportional scaling. Add up all the implied probabilities in the market to get the total overround. Then divide each individual implied probability by that total. If a team’s raw implied probability is 20% and the market sums to 125%, the no-vig probability is 20% / 1.25 = 16%. That 4 percentage point difference is entirely the bookmaker’s margin on that selection.
This method isn’t perfect — it assumes the margin is distributed equally across all selections, which isn’t quite how bookmakers operate in practice. Favourites tend to carry less margin and longshots tend to carry more, because bookmakers know that casual bettors are drawn to longshots and are less price-sensitive on those selections. For a more sophisticated approach, you can use power scaling or Shin’s method, but for most bettors, proportional scaling is accurate enough to identify clear value gaps.
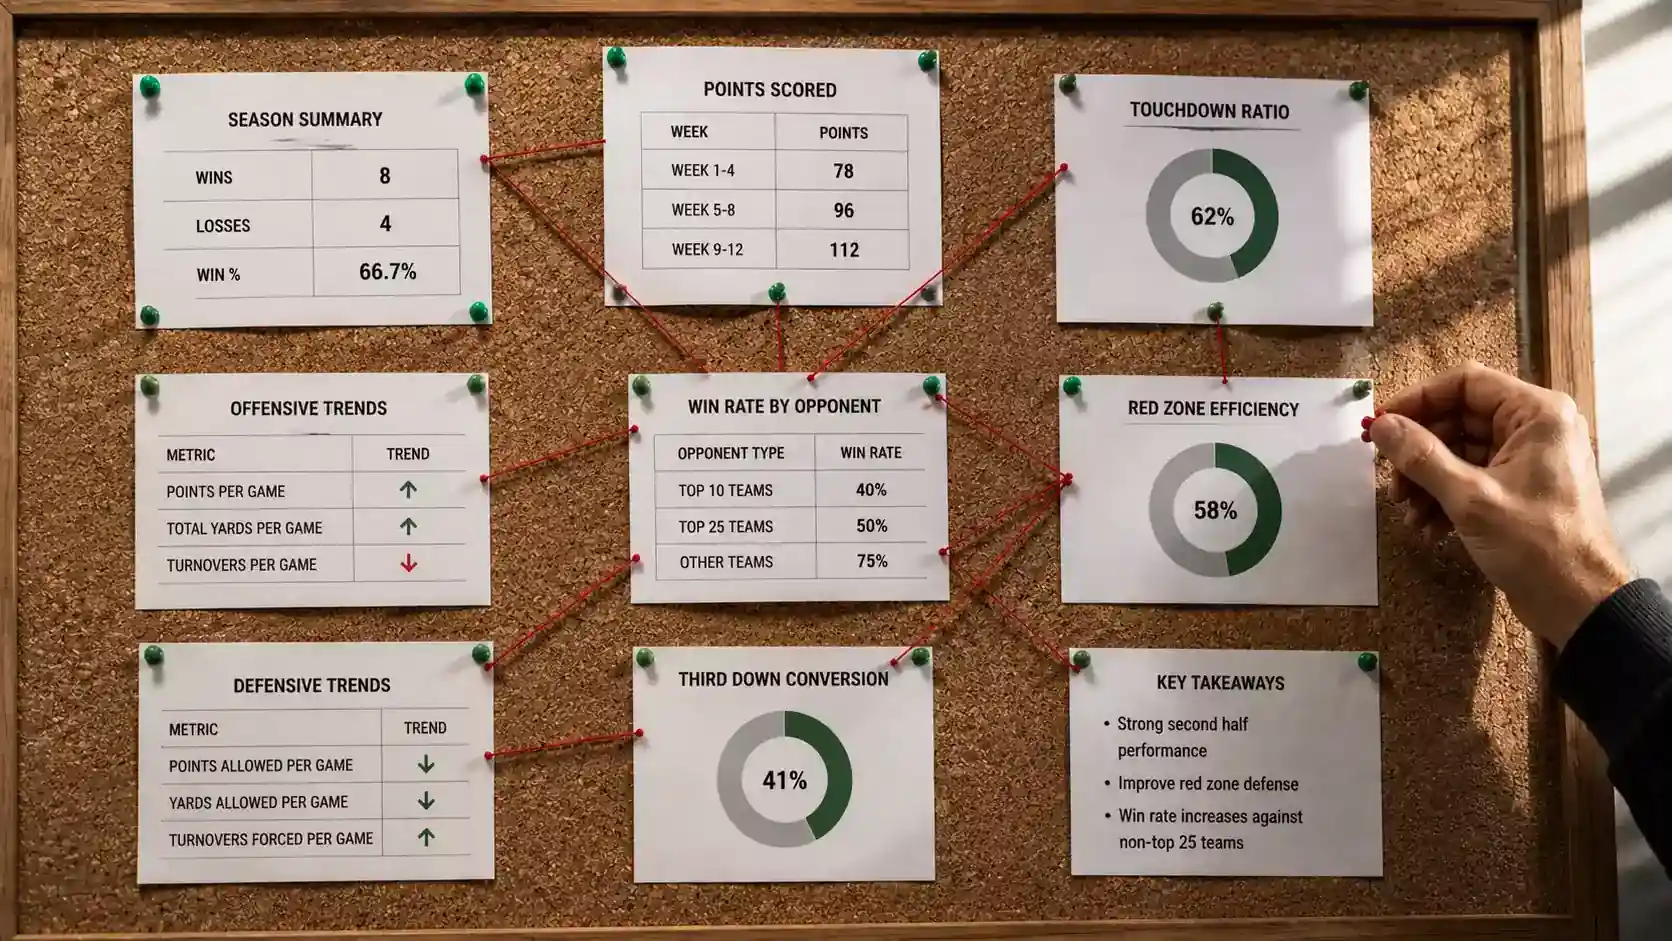
I use no-vig probabilities as my primary comparison tool. Rather than asking “is 8/1 a good price?”, I calculate the no-vig probability and compare it to my own estimate. If no-vig says 11% and I think 15%, I have a quantified edge of four percentage points. That discipline prevents me from chasing prices that “feel” good but are actually overpriced once the margin is accounted for. For a complete breakdown of why futures margins are so much higher than match-day vig, the hold percentage guide covers the structural reasons behind those inflated numbers.
What does 100% implied probability mean across a futures market?
If you add up the implied probabilities of every selection in a futures market and get exactly 100%, the bookmaker has zero margin — every price represents the true probability. In practice, this never happens. NFL futures markets typically sum to 120-155%, with the excess representing the bookmaker’s profit margin. The further above 100% the total sits, the more margin the bookmaker is extracting from bettors.
How do you compare implied probability to your own estimate?
Calculate the no-vig implied probability for the selection you’re considering, then compare it to the probability you’ve assigned based on your own analysis. If your probability is meaningfully higher than the no-vig number, the bet has positive expected value. The word ‘meaningfully’ matters — I look for a gap of at least three percentage points to account for model uncertainty and the imprecision of my own estimates.
Written by the editors at Best nfl Futures Bets.