
NFL Schedule Strength & Futures: Using SOS Data
 Available in US
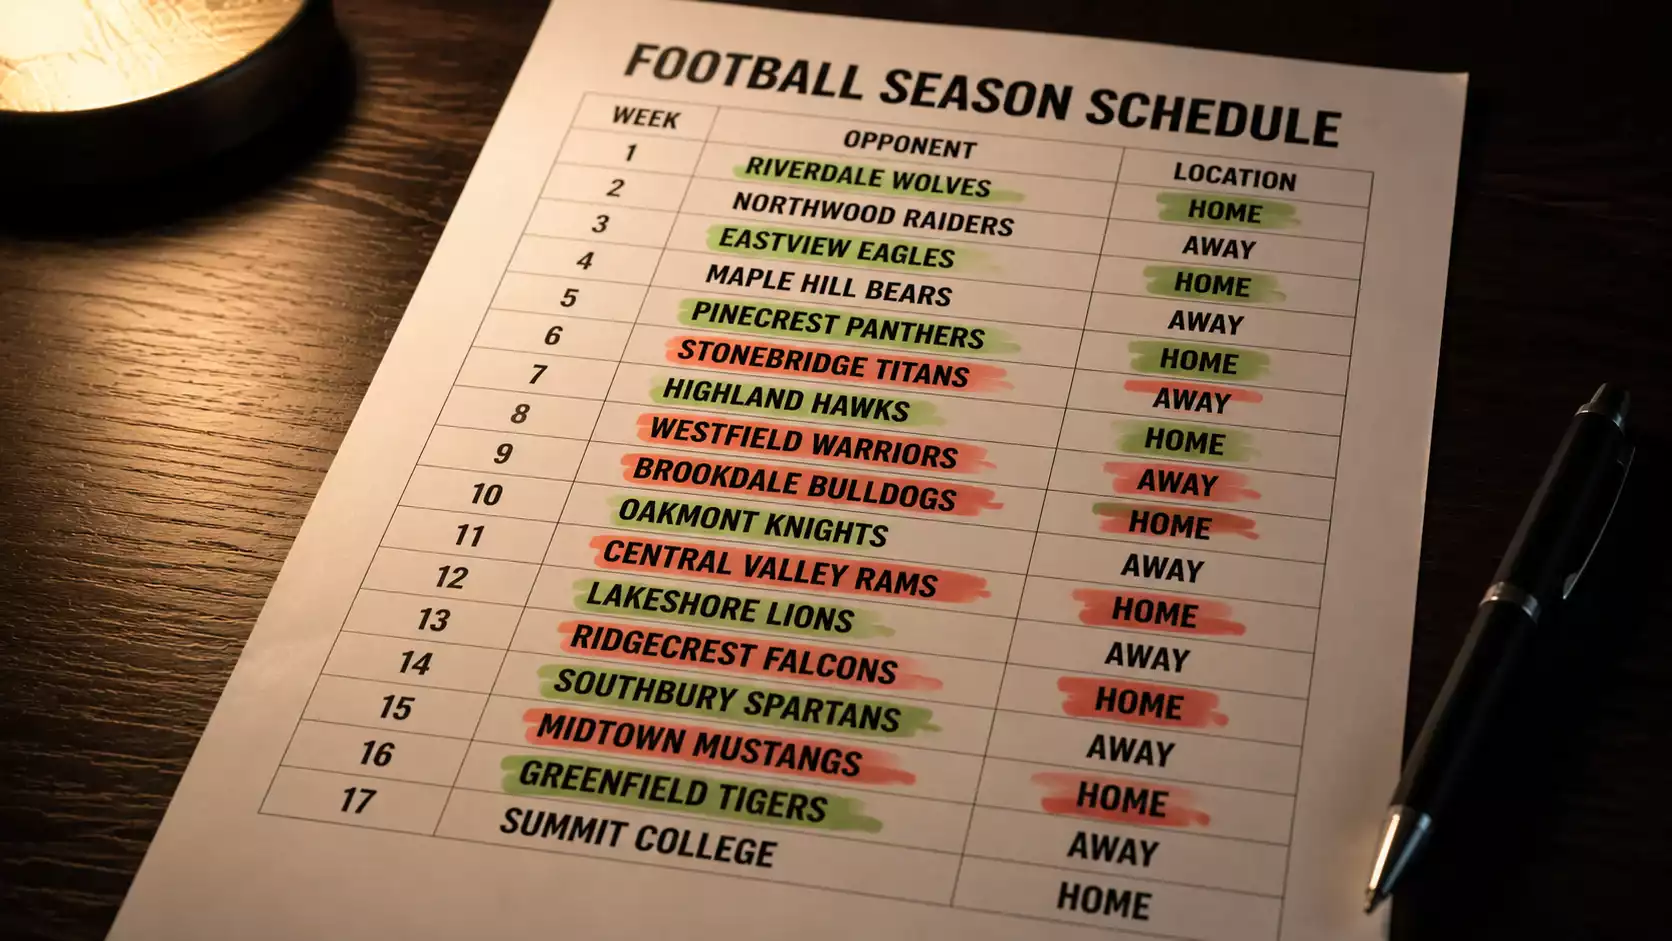
Three seasons back I bet the over on a team’s win total at 8.5, largely because their roster had improved during free agency. By Week 10, they were 4-6 and headed nowhere. The roster was fine — better than the record suggested. What killed the bet was a first-half schedule that included five games against teams that had gone to the playoffs the year before and three road games in the first four weeks. I’d evaluated the team in isolation and forgotten to stress-test the projection against the schedule they’d actually have to navigate. That’s the kind of mistake you only make once.
Strength of schedule is one of the most accessible analytical tools available to NFL futures bettors and simultaneously one of the most misunderstood. The concept is simple: some teams face harder paths than others, and that difficulty should be reflected in your win-total projections and your assessment of division-winner or playoff odds. The execution is where bettors get tripped up, because the standard SOS numbers published in the preseason are built on flawed inputs and rarely account for the factors that actually determine schedule difficulty.
Measuring Schedule Strength Methodologies
Every summer, dozens of outlets publish schedule-strength rankings based on the prior-season win percentages of a team’s 17 opponents. It’s the default metric and it’s deeply flawed. Last year’s record is a poor predictor of this year’s performance because rosters turn over, coaches change, and the regression effects I’ve written about extensively pull teams toward the middle. A team that went 13-4 last year and lost its offensive coordinator, starting cornerback, and best pass rusher is not a 13-win-calibre opponent this year — but standard SOS treats them as one.
I build my own schedule-strength estimates using projected win totals rather than prior-year records. The bookmakers’ preseason win-total lines are the sharpest available projection of each team’s strength, because they incorporate all the offseason changes — draft picks, free-agency moves, coaching hires — that raw prior-year records miss. Summing the projected win totals of a team’s 17 opponents gives a forward-looking SOS that’s meaningfully more accurate than the backward-looking version.
Even this improved method has limitations. It treats all opponents equally regardless of when and where the game is played. A road game in December against a dome team in a warm climate is not the same challenge as a home game in September against the same opponent. I add location and timing adjustments on top of the baseline SOS: home games are worth roughly 2.5-3 points of advantage, cold-weather outdoor games in December and January slightly favour teams accustomed to those conditions, and teams coming off their bye week have a measurable performance edge in the game immediately following the rest.
Schedule Strength Applied to Win Total Futures
The practical application is straightforward. After building my projected SOS for all 32 teams, I rank them from easiest to hardest and compare that ranking to the bookmaker’s win-total lines. The value opportunities appear when a team has a significantly easier schedule than the market has priced in, or a significantly harder one.
Two patterns recur annually. First, teams in weak divisions get a structural advantage that persists throughout the season. Six of their 17 games are against divisional opponents, and if those opponents are projected to win 6-7 games each, that’s six games against below-average competition baked into the schedule. Division strength is the single largest driver of SOS variance, and I weight it accordingly — a team in a division with three projected losing teams has a fundamentally easier path than a team in a division where all four teams project above .500.
Second, the back half of the schedule matters more than the front half for futures. Injuries accumulate as the season progresses, and teams with easier late-season schedules are more likely to close strong and finish over their win-total number. I’ve found that weighting the difficulty of Weeks 12-17 more heavily than Weeks 1-6 improves the predictive accuracy of my SOS-adjusted projections by a measurable margin. The market tends to treat all 17 games equally, which means late-schedule difficulty is underpriced as a factor.
For a complete framework on how schedule strength integrates with regression signals and coaching adjustments in win-total evaluation, the win totals betting guide covers the full analytical process I apply to over/under selections.
Travel Load and International Games as Futures Factors
The NFL’s expanding international programme has added a new dimension to schedule-strength analysis. In the 2025 season, the league staged a record seven overseas regular-season games, including three in London. Teams assigned to international games face travel disruptions that are unlike anything else on the schedule — multiple time zones, unfamiliar facilities, and the loss of a genuine home-game atmosphere for the “home” team playing abroad.
I’ve tracked the performance of teams in the games immediately before and after international trips, and the data shows a consistent drag. The game directly after a London trip produces a measurable decline in offensive efficiency for both teams involved, particularly when the bye week is not placed immediately after the international game. Teams that return from London and play the following Sunday without a bye perform worst of all.
Travel load extends beyond international games. The NFL schedule creates uneven domestic travel burdens — West Coast teams travelling east for early kickoffs, division rivals separated by significant distance, and the occasional back-to-back road stretch that disrupts preparation. I assign a small negative adjustment to any team whose total travel distance ranks in the top eight across the league, because the cumulative fatigue effect over 17 games is real even if its impact on any single game is small. These are the marginal factors that separate a winning futures portfolio from a losing one — not because any individual adjustment is large, but because the sum of many small edges compounds into a meaningful advantage over the bookmaker’s flat pricing.
How reliable is preseason strength of schedule as a predictor?
Standard preseason SOS based on prior-year records is a poor predictor because it doesn’t account for offseason roster changes, coaching transitions, or regression effects. A forward-looking SOS built from projected win totals is significantly more accurate. Even then, schedule strength explains only a portion of win-total variance — team talent, health, and in-season adjustments matter more, but SOS provides a useful overlay for identifying mispriced totals.
Do teams playing in NFL London games perform worse in futures?
The data shows a measurable performance decline in the game immediately following an international trip, particularly when no bye week is scheduled after the London fixture. Over a full season, a single London game assignment has a small but real negative impact on a team’s projected win total — roughly a quarter to a half win, depending on bye-week placement and travel scheduling.
Written by the editors at Best nfl Futures Bets.