EPA and DVOA for NFL Futures: Advanced Metrics
 Available in US
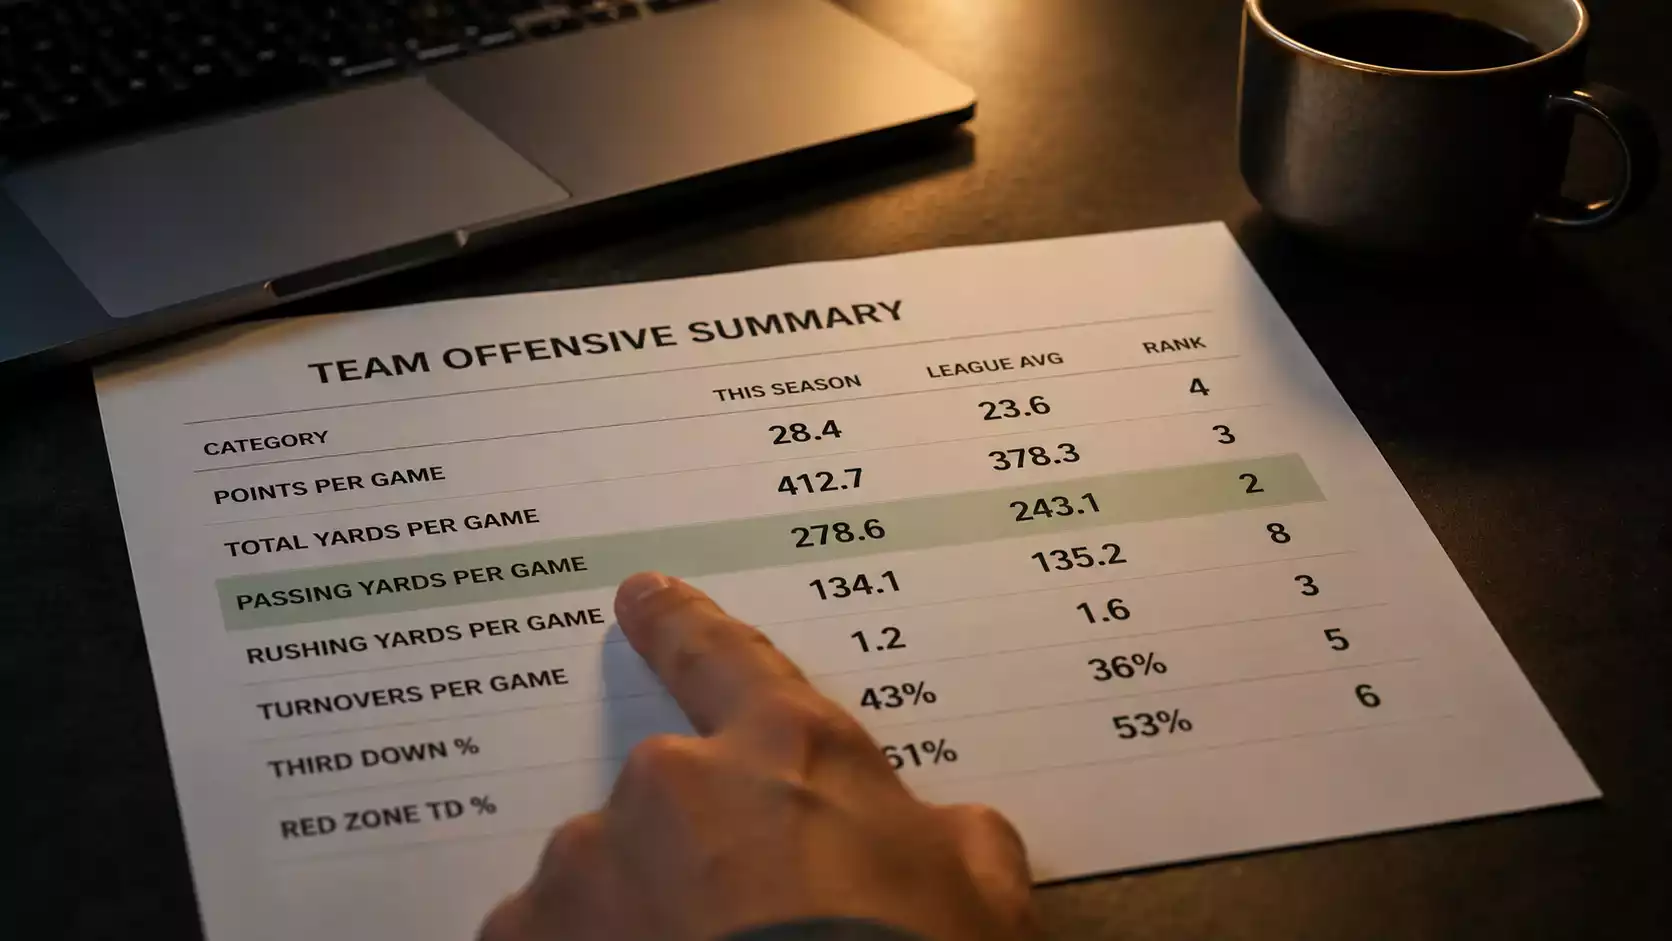
Five years ago I made every futures decision based on traditional statistics — yards, touchdowns, turnovers, win-loss records. My results were mediocre. Then I discovered EPA and DVOA, rebuilt my entire evaluation framework around them, and watched my hit rate on win-total bets improve by roughly 12 percentage points in the first season. Advanced metrics didn’t turn me into a genius. They simply replaced noisy inputs with cleaner ones, and the cleaner inputs produced better predictions. If you’re still evaluating NFL futures using box-score stats, you’re working with tools that obscure as much as they reveal.
EPA (Expected Points Added) and DVOA (Defence-adjusted Value Over Average) are the two most widely available and analytically powerful metrics for NFL futures betting. Neither requires a statistics degree to use. Both are freely accessible online. And both provide something that traditional stats cannot: a measure of quality that accounts for context — down, distance, field position, opponent strength — rather than treating every yard and every touchdown as equal.
Expected Points Added Core Measurement Principles
EPA assigns a point value to every play based on how it changes the scoring expectation for the drive. A play that moves the ball from the 50-yard line to the 30-yard line on first down increases the expected points for that drive by more than the same yardage gain on third-and-long from your own 20, because the context is different — field position, down, and distance all influence how likely the drive is to produce points.
For futures purposes, EPA per play is the single most useful team-level metric. A team that ranks top-five in offensive EPA per play is generating scoring opportunities efficiently regardless of whether those opportunities show up as impressive raw yardage totals. Conversely, a team with high total yardage but average EPA per play is accumulating production in low-leverage situations — running up stats in garbage time or moving the ball between the 20s without converting drives into points. The futures market, anchored to traditional stats and narratives, routinely misprices teams whose EPA tells a different story than their box scores.
I use EPA per play at the team level to evaluate win totals and Super Bowl odds, and at the player level to evaluate MVP and player-prop futures. A quarterback’s EPA per dropback is a far better predictor of his future performance than raw passing yards or touchdowns, because it strips out the noise of garbage-time production, opponent-quality variation, and game-script effects. When I see a quarterback whose EPA per dropback ranks in the top five but whose traditional stats place him in the top fifteen, I know the market is likely undervaluing him — and that gap is a futures opportunity.
DVOA: Adjusting for Opponents and Situations
DVOA, developed by Football Outsiders, takes the context-adjustment principle a step further by comparing every play not just to league-average expectations but to the specific opponent. A team that gains five yards per play against a top-five defence is performing better than a team that gains five yards per play against a bottom-five defence, and DVOA captures that difference. The output is a percentage above or below league average, adjusted for opponent and situation.
The opponent adjustment is what makes DVOA particularly valuable for futures. Traditional stats treat all opponents equally — yards gained against an elite defence count the same as yards gained against a poor one. DVOA reveals which teams are genuinely good versus which teams have been flattered by a weak schedule. I’ve found that DVOA-based projections outperform both raw-stat projections and simple EPA projections when it comes to predicting season win totals, because the opponent adjustment filters out schedule-related noise that persists in unadjusted metrics.
DVOA splits into offensive, defensive, and special teams components, each expressed as a separate percentage. This granularity is useful for evaluating specific futures positions. A team with elite offensive DVOA and average defensive DVOA is a better MVP candidate (since MVP voters reward offensive production) than an equal-DVOA team with average offence and elite defence. A team with elite defensive DVOA is a better under candidate for opponents’ win totals because its defence will suppress scoring in divisional games. Decomposing DVOA into its components lets you match the right metric to the right futures market.
Applying EPA and DVOA to NFL Futures Decisions
The practical application is a three-step process that I repeat before every preseason futures portfolio construction.
First, I rank all 32 teams by EPA per play on both offence and defence from the prior season. This gives me a baseline of which teams were genuinely efficient versus which teams merely had impressive raw stats. I’m looking for disconnects — teams that rank significantly higher or lower in EPA than their win-loss record would suggest. Those disconnects indicate either positive regression (underperformers whose efficiency will start converting to wins) or negative regression (overperformers riding unsustainable results).
Second, I overlay DVOA rankings to adjust for schedule strength. A team that ranked 12th in raw EPA but 6th in DVOA likely faced a harder schedule than average, and their true quality is closer to the DVOA ranking. If the bookmaker’s win-total line reflects the 12th-ranking perception rather than the 6th-ranking reality, there’s a value gap I can exploit.
Third, I project forward by adjusting for offseason changes. EPA and DVOA are backward-looking — they describe what happened last season. The critical step is modifying those baselines for roster turnover, coaching changes, and draft additions. A team that ranked 20th in offensive EPA but hired an elite offensive coordinator and drafted a first-round tackle should project higher than 20th. A team that ranked 5th but lost its best pass rusher and starting cornerback should project lower. The analytical framework that treats futures as a portfolio — spreading positions across markets to balance risk while maintaining upside on high-conviction plays — relies on this kind of metric-driven evaluation as its foundation. The futures strategy guide covers how EPA and DVOA fit into the broader portfolio-construction process.
Where can UK bettors access free EPA and DVOA data?
EPA data is available through several free sources, including rbsdm.com (which provides play-by-play EPA data) and nfelo.com. DVOA is published by Football Outsiders, with basic team rankings available free and more detailed data behind a subscription. Both metrics are discussed extensively in free analytical content from sites like The Athletic, PFF, and various independent NFL analytics accounts on social media.
How well do EPA and DVOA predict NFL win totals?
EPA per play and DVOA are among the strongest predictors of future win totals in publicly available NFL analytics. In backtesting, DVOA-based projections explain roughly 30-35% more win-total variance than raw yardage or points-based projections. The improvement comes from the context and opponent adjustments that strip out the noise of schedule difficulty, game script, and garbage-time production. They are not perfect predictors — no single metric is — but they provide a significantly cleaner signal than traditional statistics.
Created by the ”Best nfl Futures Bets” editorial team.